

What You’ll Learn
This study shows what measurable improvement looks like when fleet data is actively used to influence driver behavior, and what your fleet should be aiming to achieve.
You’ll learn:
- What level of reduction in speeding and risky driving is achievable with structured coaching
- How idle time reduction can quickly translate into measurable fuel savings
- Where your fleet performance may sit relative to real-world benchmarks
Real-World Results. Measurable Risk Reduction. Immediate ROI.
What happens when fleet data stops being passive and starts driving action?
To find out, a 7-month study was conducted using the Teletrac Navman TN360 platform across 10 vehicles. Management teams used real-time driver behavior reporting in the TN360 Safety package, including speeding, aggressive driving, idle time, fuel usage, and CO₂ emissions, to actively build a culture of accountability.
The result wasn’t an incremental improvement. It was transformational.
More importantly, it provides a benchmark for what fleets can expect when data is actively used to drive accountability.
Read on to see how.
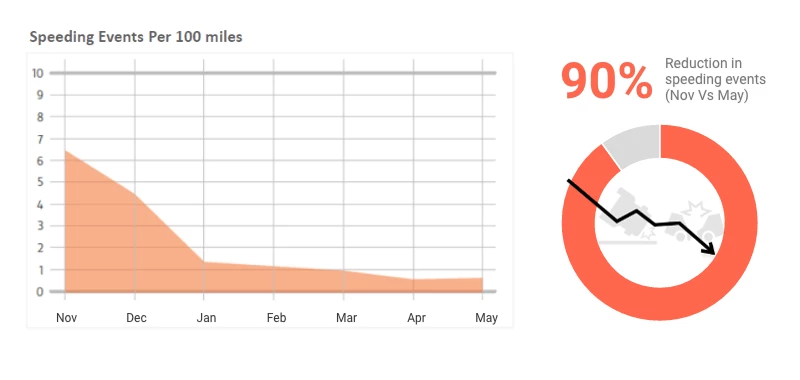
90% Reduction in Speeding Events – A Benchmark for What’s Achievable
Speeding is one of the most direct predictors of collisions, insurance exposure, and reputational risk.
During the study period (November 2023 – May 2024), speeding events per 100 miles dropped dramatically:
6.52 events ➝ 0.59 events
By leveraging TN360 driver behavior reports, management implemented targeted coaching sessions and created a data-backed safety culture that delivered a 90% reduction in speeding incidents.
Fewer speeding events mean:
- Lower accident risk
- Reduced legal exposure
- Stronger defensibility in claims
- Safer drivers on the road
What This Means for Your Fleet
Speeding is one of the most controllable contributors to risk. If reductions don’t occur, it often points to gaps in visibility or coaching consistency.
This study shows that substantial improvement is achievable through complete visibility and effective driver coaching and communication.
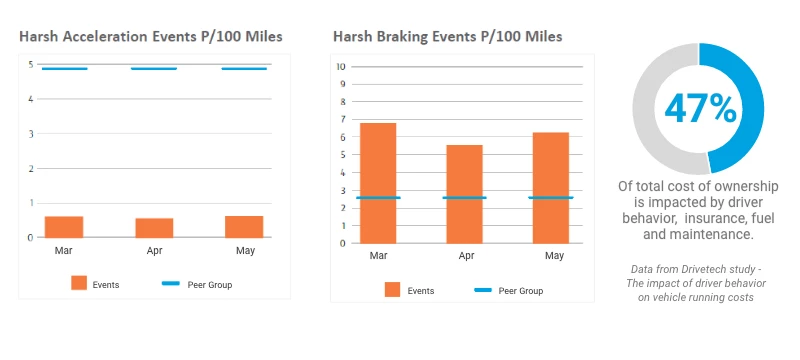
Smarter Driving = Lower Wear & Tear AND Lower Operating Cost
The data also revealed:
- Harsh acceleration events fell below peer-group benchmarks
- Harsh braking remained slightly elevated, highlighting a clear opportunity for further cost reduction
This kind of visibility doesn’t just improve safety. It identifies where operational costs can be reduced through proactive coaching and performance monitoring.
What This Means for Your Fleet
Harsh driving behaviors are early indicators of higher fuel use and maintenance cost.
If these trends aren’t improving, it may suggest that driver feedback isn’t being consistently applied.
Reducing these events is a key signal that behavior change is taking hold.
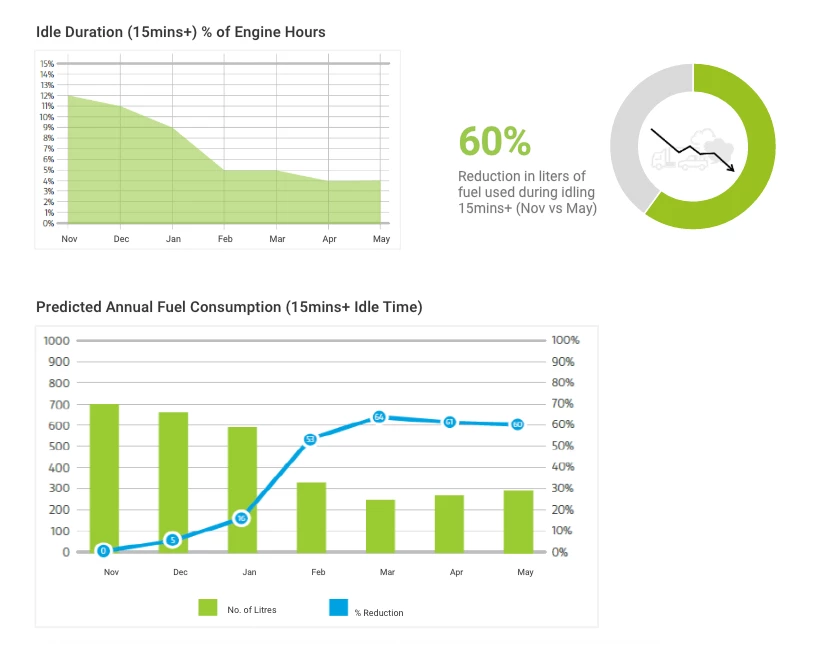
60% Reduction in Idle Time. One of the Fastest Paths to ROI.
Idle time (15+ minutes) as a percentage of engine hours fell from 12% to 4% during the pilot.
That 60% reduction may seem minimal, but at scale, the financial impact becomes significant.
Projected across a 500-vehicle fleet, the reduction equates to:
- 5,521 gallons saved
- 56,600 KG reduction in CO₂ emissions
- $40,308 reduction in fuel spend
Lower fuel costs. Reduced emissions. Improved environmental impact. All driven by actionable data.
What This Means for Your Fleet
Idle reduction is one of the quickest and most accessible ways to generate ROI from telematics. Because it’s highly visible and easy to act on, many fleets can achieve significant improvements quickly.
This study shows that a 2–3x improvement is realistic, and that those gains can translate into real cost savings across your fleet.
The Bottom Line
This study demonstrates what happens when fleet data moves beyond reporting and becomes a leadership tool.
TN360 didn’t just track behavior.
It enabled accountability, coaching, measurable cost control, and safer driving habits.
If reducing risk, controlling fuel spend, and improving driver performance are priorities for your fleet, the next step is understanding what this could look like for you.
Discover how TN360 can reduce risk, cut costs, and improve operational performance across your vehicles and assets.
**Results are based on a limited pilot study conducted under specific operational conditions. Individual fleet results may vary depending on vehicle type, driver behavior, operating environment, implementation approach, and other factors.