
Driver Behavior Monitoring System
Why businesses are investing in fleet data
Data has many meanings. Virtually any business that has invested in a GPS tracking solution can track the location of their vehicles by pinpointing them on a map. But times have changed. The sophistication of data has expanded to deliver the real financial costs of a vehicle and driver behavior on the road.
Progressions in technology can now tie driver behavior directly to company benchmarks, including safety behavior, fuel use and the vehicle maintenance costs. The right software will identify a company’s biggest priorities, whether it’s revenue, customer satisfaction or federal compliance, and deliver that data to motivate daily business decisions.
Driver monitoring devices help businesses record daily vehicle activity without physically reaching inside the hood of a vehicle to extract information. This data gives users a powerful look at the health of their business through custom vehicle statistics about their fleet’s activity. This type of deep data goes beyond track-and-trace information by steering a company’s focus towards items, such as the total time spent at a job site, that may have been previously overlooked. In-depth data leads to more informed business decisions that can impact a company’s financial success.
The versatility of fleet data helps track and monitor fuel waste and related costs, distances and miles traveled, idle time including power take-off (PTO) time, and driving habits, for single vehicles, sub-group or an entire fleet. GPS fleet tracking software provide a full view of this fleet performance data, including the lowest and highest ranking vehicles for each of the metrics, giving users a handful of productivity, diagnostics and maintenance data.
Overall, actionable vehicle tracking data can benefit even the smallest of fleets. Obvious GPS data can give you peace of mind when you want to ask “Where are my vehicles?” but using comprehensive fleet data as part of everyday fleet management can help cut down fuel consumption and other inefficiencies, increasing a fleet’s lifespan, productivity levels and cost savings.
The cumulative number of miles a driver has accrued for a specific time period
Amount of fuel used by a driver, which can be impacted by harsh driving, idle time and unnecessary stops
 Idle Time
The total time a vehicle’s engine is running when the vehicle is not in motion
Data summarizing engine statistics and fault codes in addition to routing information and service mileage
The number of stops a driver takes while on the clock, including en route to a job site
The time a driver clocks in and clocks
out each day
The total time a driver spends delivering and completing a task at a job site
The total time, length and number of breaks that a driver takes on the road each day
MEETING YOUR NEEDS
Create Your Bespoke Solution Online
Every fleet operation is unique and has a need to measure different KPI's that are effected by driver behavior. From monitoring productivity to creating safety programs we have the solution to meet your needs.
Monitor the data that matters
What is driver behavior data?
Good driving habits can have a significant impact on a business. A quick mistake on the road can negatively affect a company through accident, injury and liability costs and even a loss of business.
Most managers fail to see the total impact of a crash on their business. While the direct costs, such as vehicle repair and insurance payments are easy to calculate, the indirect costs are severe. These numbers, including crash reports, time and money
spent on litigation and the loss of productivity on the company are proven to be 3-5 times more expensive than the direct costs of the accident.
Safety data provides fleet managers with the eyes and ears to be a backseat driver without stepping foot into a vehicle. Managers can assess the strongest and weakest drivers in their fleet by consistently monitoring the safety behavior of their employees on the road.
The total cost of a crash with injuries can range from $25,500 to $4,500,000 and medical costs and productivity losses from crashes are over $99 billion.
The best way to combat dangerous driving habits? Consistent driver coaching. Mangers should ask themselves, “Are my drivers receiving tickets? Speeding? Running stop signs? Veering on the road?” Driver monitoring devices have proven to be the most valuable tool to eliminate these high-liability issues.
In fact, a recent Teletrac Navman study* concluded that 40% of drivers change their behavior after their first safety warning.
Driver monitoring devices help managers track their drivers’ speed and review aggressive driving behaviors, such as speeding, harsh braking, cornering and stop sign violations.
The safety software arms managers with the following powers: The ability to view safety data on demand. Managers can quickly measure a fleet’s safety average through the score indicator based on safety parameters, including harsh braking, harsh acceleration, speeding and stop sign violations.
Staying updated with safety events and averages. Dashboards help log events for each parameter—whether it’s for five speeding events or 138 harsh braking violations per fleet.
The most useful tool? The ability to see the top 10 worst and best drivers in a fleet—including an individual driver safety score— allowing managers to monitor safety performance across their drivers.
Driver Scorecards
Everything You Need In One View
The Driver Scorecard has been designed to give fleet managers instant visibility into driver performance data. In one view you can track fleet wide performance and individual driver trends, giving you everything you need to get safety and efficiency on track.
Driver Behavior Monitoring
What data is measured?
Speeding for each vehicle is determined by matching GPS data to a map database which contains speed limit information. GPS speed is then compared to actual speed limits while the length of each vehicle infraction is recorded.

GPS data is used to determine which streets a vehicle has traveled. The data is then matched with a map database to determine the location of each violation.

The number of heavy braking incidents based on G-Force and the type of vehicle (light, medium or heavy).

The number of acceleration incidents based on G-Force and the type of vehicle. Harsh acceleration can cause unnecessary wear and tear on the vehicle and can pose a safety hazard to the driver and other vehicles
The number of forceful or quick cornering incidents that are identified for each driver or time period.

Insight into a company’s Compliance, Safety and Accountability score, possible violation types and how businesses can avoid accumulating points.
Easily see your fleet safety data
Driver Behavior Monitoring System
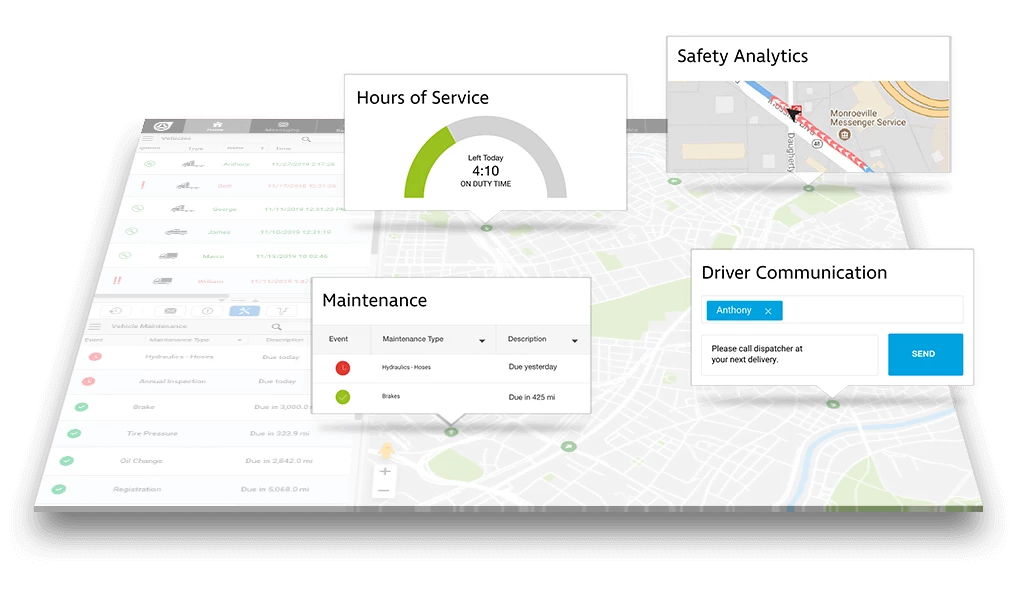
The power to monitor vehicle and driver behavior allows businesses to have a strong competitive advantage. Teletrac Navman’s DIRECTOR™ platform goes beyond location tracking to offer businesses measurable data that provides a snapshot of daily vehicle and driver activity. Having access to accurate behavioral data— such as fuel use, productivity levels and safety patterns—allows companies to stay efficient, productive and cost-effective.
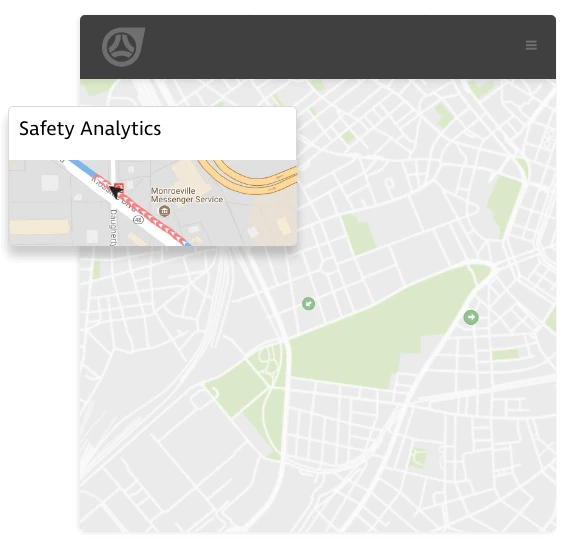
Safety Analytics
The Safety Analytics feature in DIRECTOR empowers users to receive insight into vehicle safety based on key performance metrics and recorded events, such as speeding and harsh braking. The results, including a measurable safety score, are showcased on data-rich dashboards.
This advanced feature pinpoints safety violations and inefficiencies—such as worst safety rankings and more— for an entire fleet or a single vehicle. Managers can use this effective option to prevent vehicle abuse and monitor unsafe driving behavior.
Get Pricing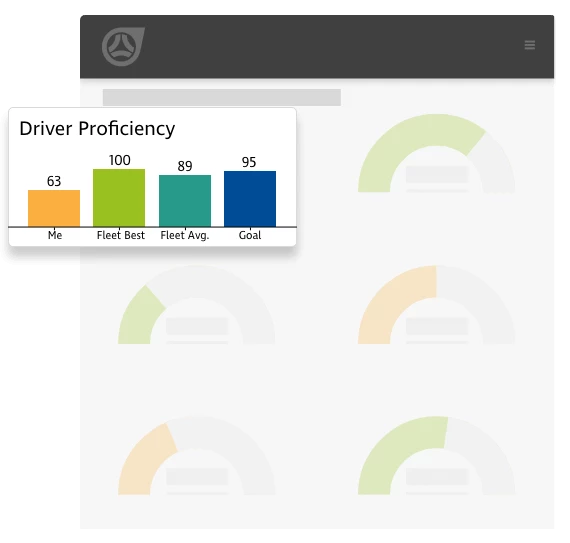
Scorecards
The Scorecard feature enables users to get a remote look at important driver performance metrics to best measure key inefficiencies across a fleet.
This flexible analytics tool features a data-rich, color-coded dashboard that showcases driver performance for single vehicles, sub-groups, or an entire fleet. Users can drill down in to any of the metrics for a detailed look at performance. The best and worst driver rankings are clearly displayed to indicate which drivers within the fleet are performing at the highest level.
Check out the scorecard's feature:
Get Pricing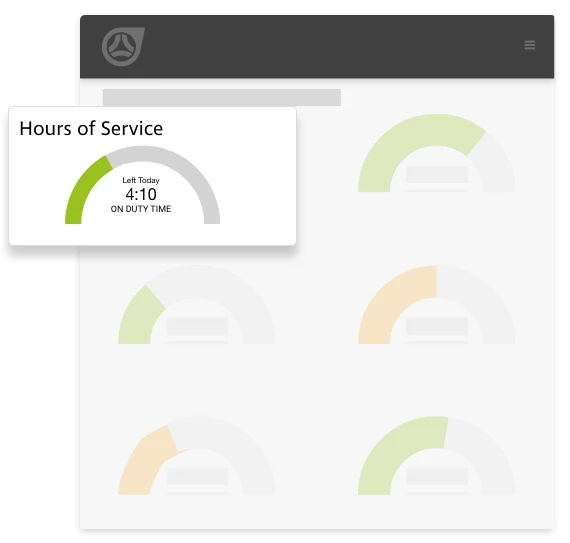
Reporting
Vehicle and driver behavior software provides a clean snapshot of metrics related to fleet performance, including a close look at fuel consumption and costs, idle time, travel trends and safety activity. Available reports include:
- Mileage
- Executive Summary
- Time Sheet
- Maintenance
- Driver Stops